
METU HS Ankara 2015 Team
VARROA CULA


Modeling

Figure 1. The simple circuit design of Varroacula Project includes Constitutive Promoter (J23100), Ribosome Binding Side (B0034), our new part Cinnamyl Alcohol Dehydrogenase1 (CAD1) and Terminator (B0015).
We used constitutive promoter for our device in wetlab and designed simple circuit. However, in order to isolate our engineered organism, we thought we need to have a repression and activation in design. Therefore, we divided the models into two; as model without regulation and model with regulation.
1. Model without regulation
In this model we wanted to show basically what we have done in wetlab in mathematical model. Firstly, our mathematical model without regulation depends on those assumptions;
-
mRNA and protein concentration are demonstrated R and P, respectively.
-
Concentration of both mRNA and Protein at the begining is zero.
-
All the cells that operate our circuit express the gene and produce enzyme similarly.
-
The substrate(Cinnamyl alcohol) diffuses into cell and infinitely found in a cell.
Then we calculated the rate of change of mRNA concentration;
dmRNA/dt= (θ * ε )-( α + log(2)/30)*[mRNA]
And rate of the change of Protein concentration;
dProtein/dt=( γ *[mRNA])-(λ +log(2)/30)*[Protein]
Where,

Figure 2. The parameters have been obtained from litreture and previous iGEM teams work. For example, the maximal expression level of J23100 has been taken as measured by Team Warsaw 2010.
mRNA and Protein Molecule versus time
Molecule

Figure 3: The defined mRNA stands for immediately after transcription of CAD1 enzyme . Here we have obtained the graph which indicates the molecules of CAD1 enzyme and mRNA, respectively.
2) Model with regulation
However we wanted to design our circuit as operated in an isolated area with the presence of Arabinoseby E.coli BL21(DE3). Although we showed our work in basic circuit with constitutive promoter in wetlab, we also wanted to see how we can isolate the engineered E.coli in mathematical model as safe as possible. Therefore, let us introduce you our model that is a combination regular production of CAD enzyme with kill-swith system.
1. Amount of both mRNA and Protein at the begining is zero.
2. All the cells that operate our circuit express the gene and produce enzyme similarly.
3. 600 molecule of Cinnamyl alcohol diffuse into cell and then the production has started.

Figure 4. To provide safety and isolate E.Coli BL21(DE3) not to contaminate nature, we have designed the circuit which is regulated by presence and absence of Arabinose.
The principal of circuit is basically;
-
Presence of arabinose would provide TetR-LVA production that can repress the TetR Promoter which further generates Holin and Endolysin.
-
Absence of arabinose can no more repress the TetR Promoter and the accumulation of Holin and Endolysin would cause cell death.

Figure 5. Parameters have been obtained from previous iGEM teams and also assumed.
Molecule versus time
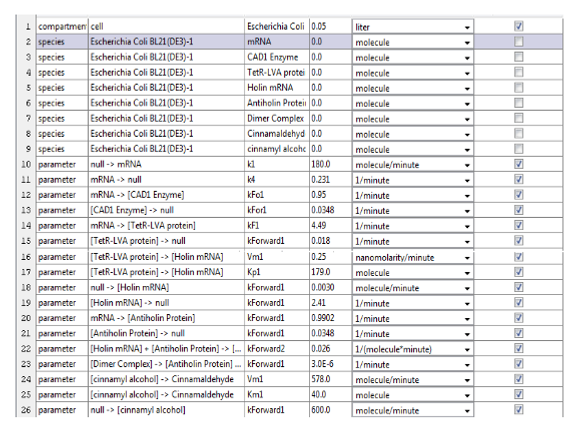
Figure 6. Parameters have been adapted to the equations in order to put in MatLab.

Figure 7. Definitions of the variables have been given in abbrevation.

Figure 8. The schema indicates starting from the mRNA and ending up to amount of CAD1, TetR-LVA, Holin, Antiholin and also steps in the pathway.

Figure 9. The graph demonstrates that the increase in amount of CAD1 enzyme, TetR-LVA protein, Antiholin with respect to the increase in amount of mRNA transcribed. Absence of Holin in model lead to the sharp increase in amount of Antiholin.
Equation 5. Production of Endolysin
d[Endom]/dt = θ x ((((TetR-Mx) x [TetR-LVA]^(( δ ) x ([TetR-LVA]))) / ((( [TetR-LVA]^ (( δ ) x ([TetR-LVA]))) + ((DtetR)^ (( δ ) x ([TetR-LVA]))))) + ( MtetR)) – (( dmRNA) + (α)) x [Endom]
d[Endo]/dt = (a/Sendo) x [EndomRNA] - d[Endo] x [Endo]
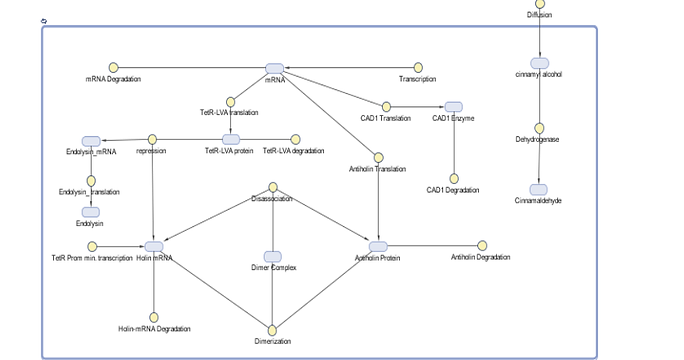
Figure 10. The schema additionally shows diffusion of Cinnamyl alcohol (assumed) , dimerization between Holin and Antiholin , production of Endolysin.

Figure 11. The graph indicates the increase in Cinanmaldehyde after uptaken to cell, decrease in holin and antiholin in regard of dimerization and leakage of endolysin.
Equation 6. Dimerization of Holin and Antiholin
Dimer formation of Holin and Antiholin ;
d[HAH]/dt = kfHAH x [H] x [AH] - kb,HAH – dHAH x [HAH]

Figure 12. The graph shows that the increase in the amount of dimerization between holin and antiholin which dominate the effect of holin with antiholin and provide the survival of E.Coli.
190 molecule of Holin would be effective, and we aimed to achieve to produce that amount of Holin together with Endolysin would cause cell death. Therefore; when the arabinose is absent ;

Figure 13. The graph is obtained as simulating after absence of arabinose, the increase in amount of Holin and Endolysin can be seen. For a cell, after 190 molecule of Holin would be lethal and we have proved it in our model in the certain time interval.
We have successfully completed model in regard of our circuits. The results were obtained in an expected way.To start with the simple circuit, we wanted to see the strictly increase in the production of CAD1 enzyme and we have shown in our model. Second, in circuit with regulation, we wanted to show model of our future aspect in which we isolate E.Coli BL21(DE3) in Arabinose solution and operate to acheive certain dose of CAD1 enzyme production and Kill-Switch mechanism depending on presence and absence of Arabinose. Also, the production of Cinnamaldehyde has been shown in our model with repect to the assumed diffusion of Cinnamyl alcohol.
Equation 1. Production Of CAD1 Enzyme
dCAD1m/dt= θ x ParaC - αx dmRNA x [CAD1m]
dCAD1/dt= (a/ Scad1) x [CAD1m] - dCAD1 x [CAD1]
Equation 2. Production Of TetR-LVA
dTetLVAm/dt= θ x ParaC α - x dmRNA x [TetLVAm]
dTetLVA/dt= (a/Stet) x [TetLVAm] -dTetLVA x [TetLVA]
Here we have assume thedegradation rate of transcribed TetLVA.
Equation 3. Production of Holin
dHm/dt = θ x ((((TetR-Mx) x [TetR-LVA]^(( δ ) x ([TetR-LVA]))) / ((( [TetR-LVA]^ (( δ ) x ([TetR-LVA]))) + ((DtetR)^ (( δ ) x ([TetR-LVA]))))) + ( MtetR)) – (( dmRNA) + (α)) x [Hm]
d[H]/dt = (a/Sh ) x [HmRNA] - d[H] x [H] - kf,HAH x [H] x [AH]
Equation 4. Production of Antiholin
d[AHm]/dt = θ x ParaC - α x dmRNA x [AHm]
d[AH]/dt= (a/Sah) x [AHm] - d[AH] x [AH] - kf,HAH x [H] x [AH]
When the arabinose is present, the schema can be drown like given below and the graph was obtained with respect to this schema to show the dimerization of holin and antiholin;
References
-
http://www.sciencedirect.com/science/article/pii/S0012160608013171
-
http://www.rpgroup.caltech.edu/courses/Physiology%20Matlab%202015/files_2015/GeneExpression.pdf
-
http://2009.igem.org/Team:Aberdeen_Scotland/internal/SimBiology
-
http://2011.igem.org/Team:UPO-Sevilla/Project/Basic_Flip_Flop/Modeling/Basic_Bistable
-
Savva, C.G., Dewey, J.S., Deaton, J., White, R.L., Struck, D.K., Holzenburg, A., and Young, R. (2008) The holin of bacteriophage lambda forms rings with large diameter. Mol Microbiol 69: 784–793 http://www.ncbi.nlm.nih.gov/pubmed/18788120. Accessed October 14, 2014.
-
Wang, I.N., Smith, D.L., and Young, R. (2000) Holins: the protein clocks of bacteriophage infections. Annu Rev Microbiol 54: 799–825http://www.ncbi.nlm.nih.gov/pubmed/11018145. Accessed October 13, 2014.
-
Young, R., and Bläsi, U. (1995) Holins: form and function in bacteriophage lysis. FEMS Microbiol Rev 17: 191–205 http://www.ncbi.nlm.nih.gov/pubmed/7669346. Accessed October 14, 2014.